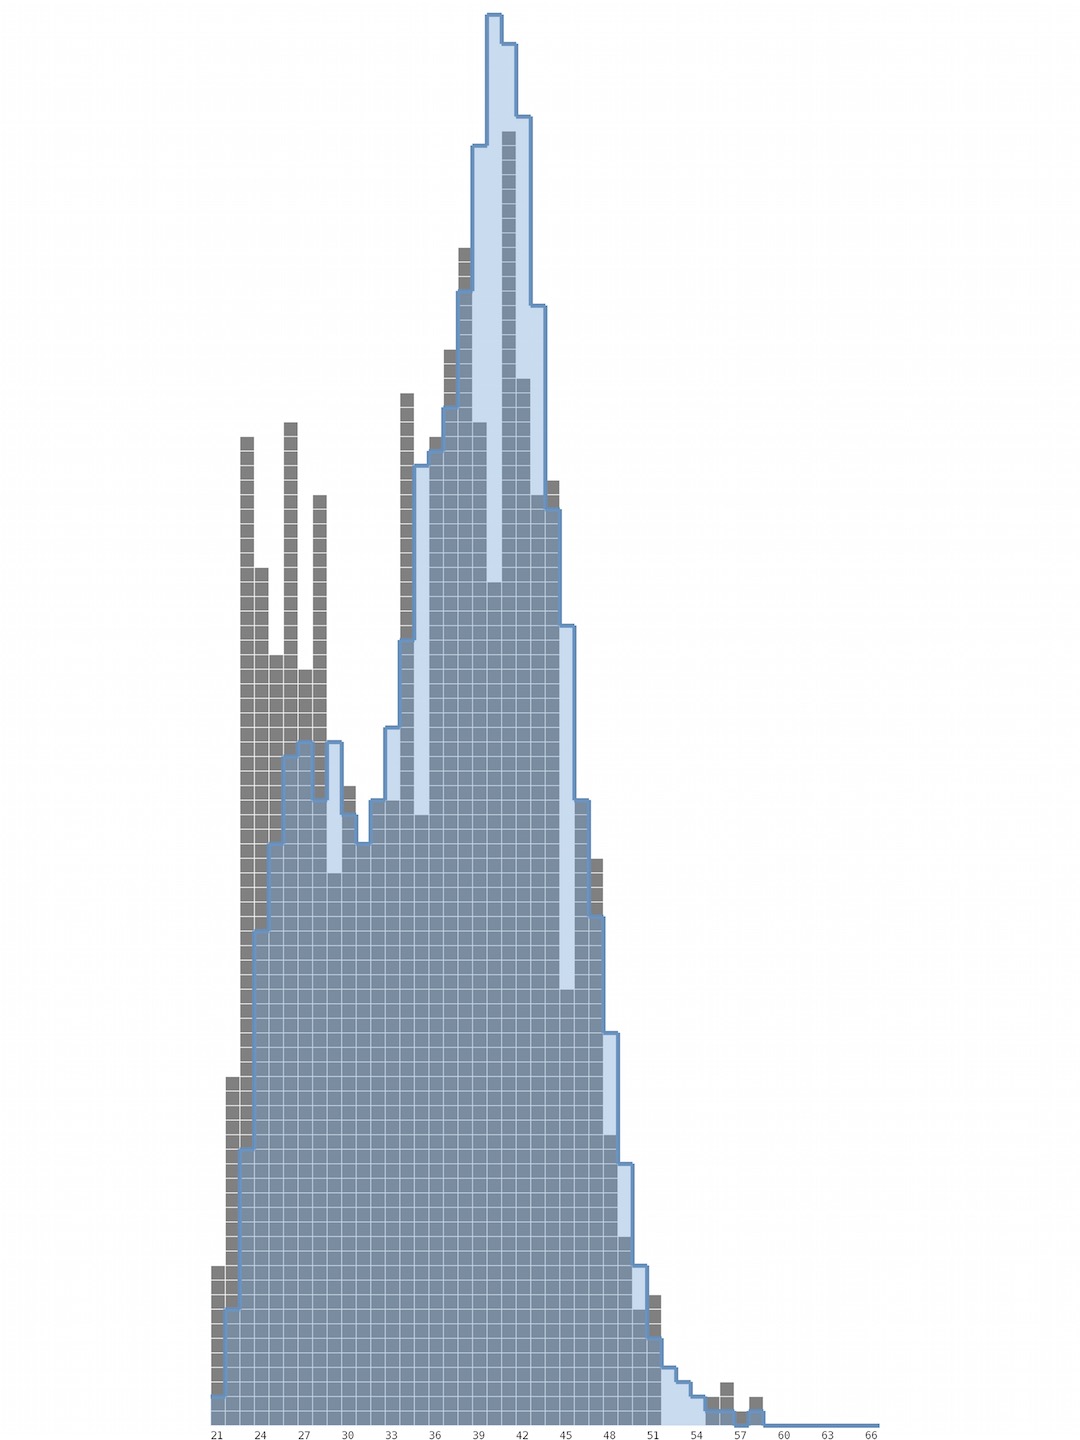
Officer Age
This is an evenprior glyph histogram of officer age. The grey glyphs represent officers in the positive class on the training set. The blue region represents what would be the negative class, were it the same total size as the positive class—i.e., if the prior probabilities on positive and negative were even. We can use this plot to see how officer age helps our model distinguish between classes. Older officers are more likely to be in the positive class, and younger officers in the negative class. Evenprior glyph histograms are related to lift-pull plots (see Officer age II), but allow the user to see the precise distribution of positive training examples.