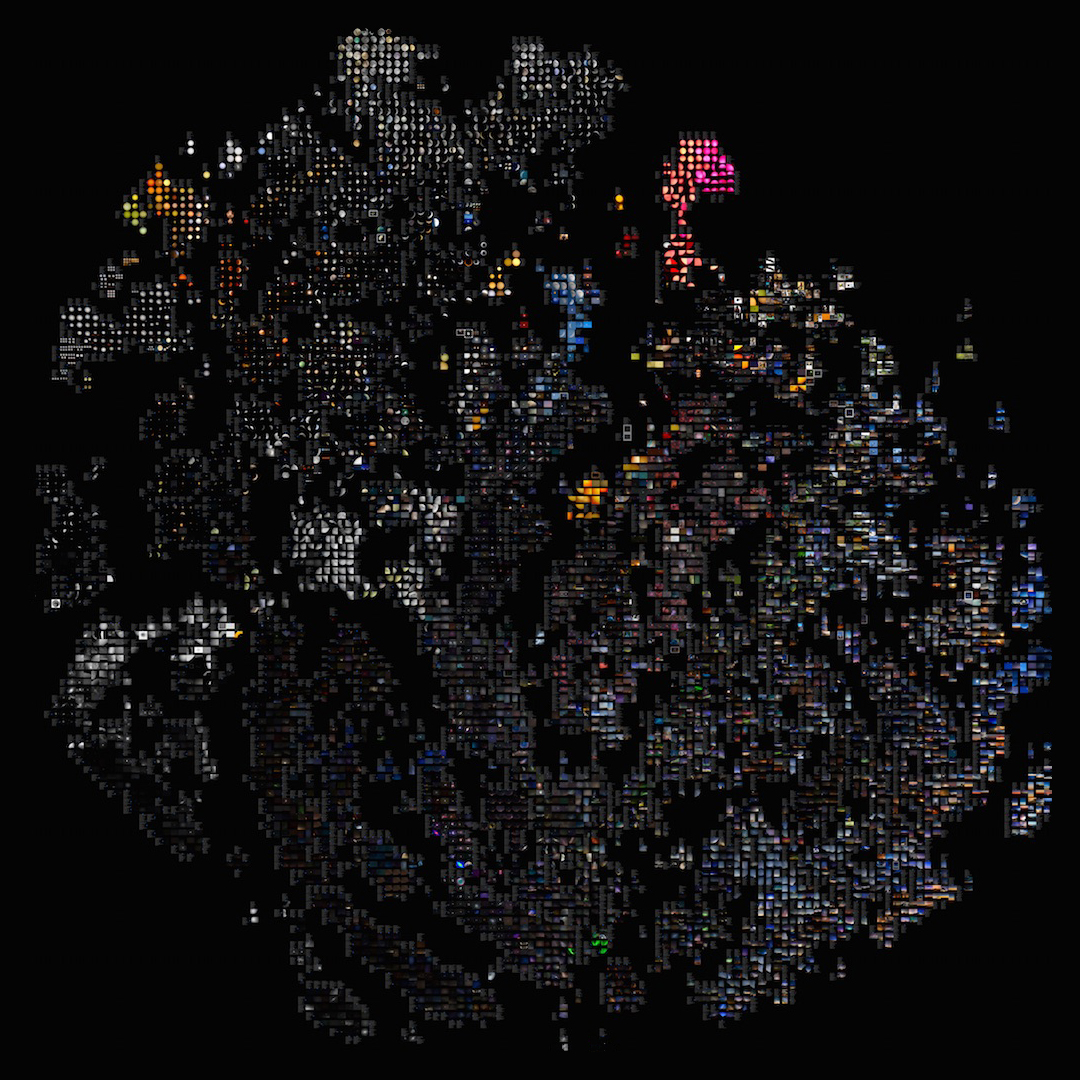
Tag-annotated t-SNE map of Flickr images with the “astrophotography” user tag. Images are organized in “tag space”—the similarity space defined by confidence scores for over 1000 machine tags. Although many of the tags are inaccurate (see below), an excellent visual similarity space results nonetheless. This image allows us to see at a glance the visual landscape of astrophotography images posted to Flickr.
astrodata ACTIVE
astrodata is a data project that analyses the rise of astrophotography around the world. Astrophotography
used to be a pursuit strictly reserved for specialist professional photographers with high-end image capture equipment,
and before that, scientists working in the fields or astronomy and space exploration. Over the last fifteen years, as
digital camera manufacturers have offered ever higher quality sensor technology across their camera ranges (including
entry-level models) amateur and “prosumer” production of astrophotography has grown rapidly. This project seeks to
understand this rapid growth, to analyse the wealth of data around this emerging genre to understand for the first time
what is happening in a field that both professional photographers and non-professional photographers participate in.
The project, which is now in its final stages, has two distinct parts. The first is a very visually-driven website that discusses astrophotography and its increasingly amateur stable of practitioners, reports a collection of findings from our data—many of them confirmations of hypotheses we had at the outset—and offers an interactive data exploration tool (see bottom). The second part is a sociological study about the rise of amateur astrophotography, how it fits into the practice of photography more generally, and how it has become a largely data-driven endeavor.

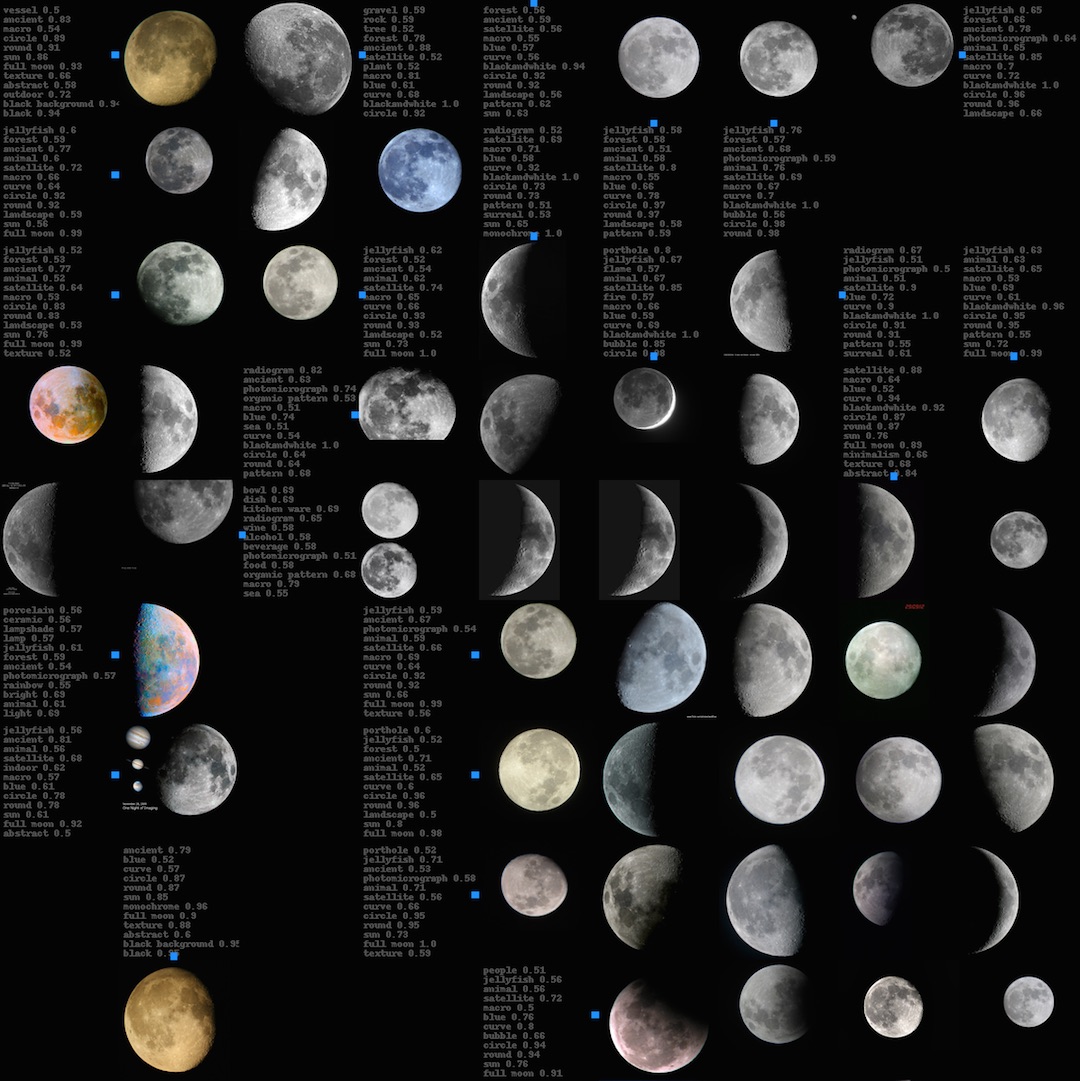
Zoom detail of image above. Some tags are obviously inaccurate, but if that error repeats across all similar-looking images—as it should—then the errors do not corrupt the derived similarity features in our data.

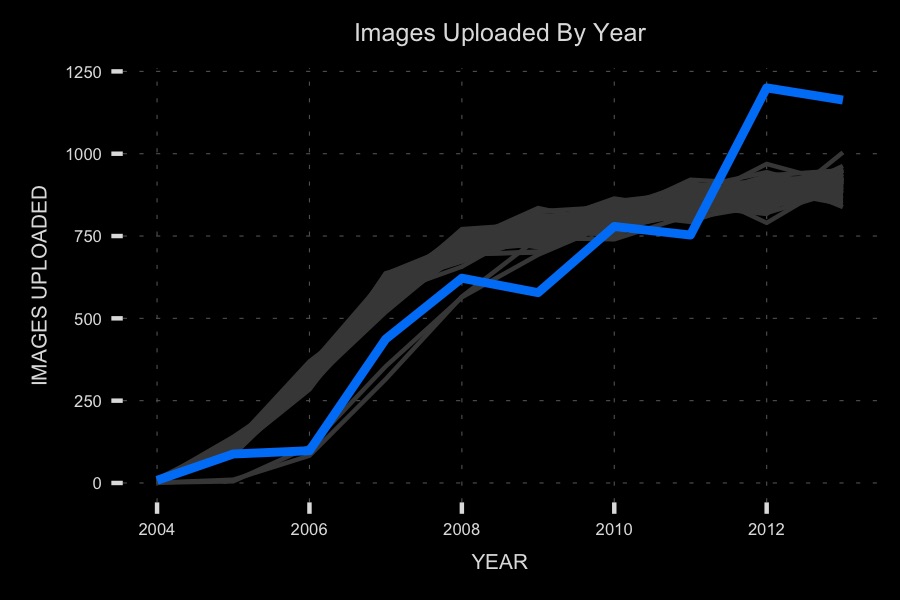
Growth in the volume of astrophotography images posted to Flickr has accelerated in recent years, even relative to the overall growth of Flickr, represented by grey lines. Each line is a sample—of the same size as our astrophotography dataset—from a dataset of 100 million Flickr images.

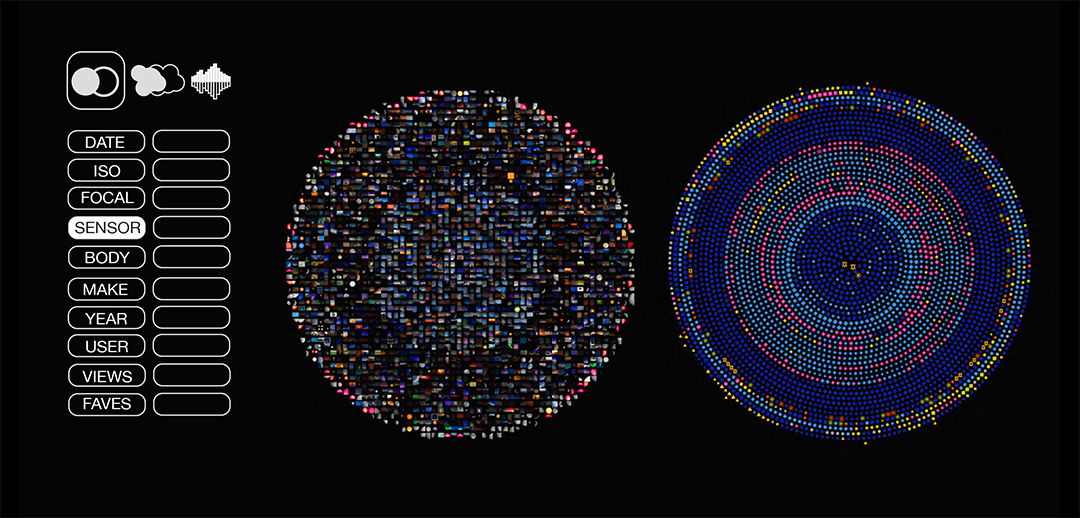
Concept for our interative exploration tool. The two plots are identical except that the left plot uses images as plot elements, and the right plot uses glyphs carrying metadata information as plot elements. Users can choose variables for sorting plot elements and can select from among three plot types: circle plots (shown), histograms, and cluster plots. Mousing over either an image or glyph links it to its corresponding icon in the adjoining plot.


