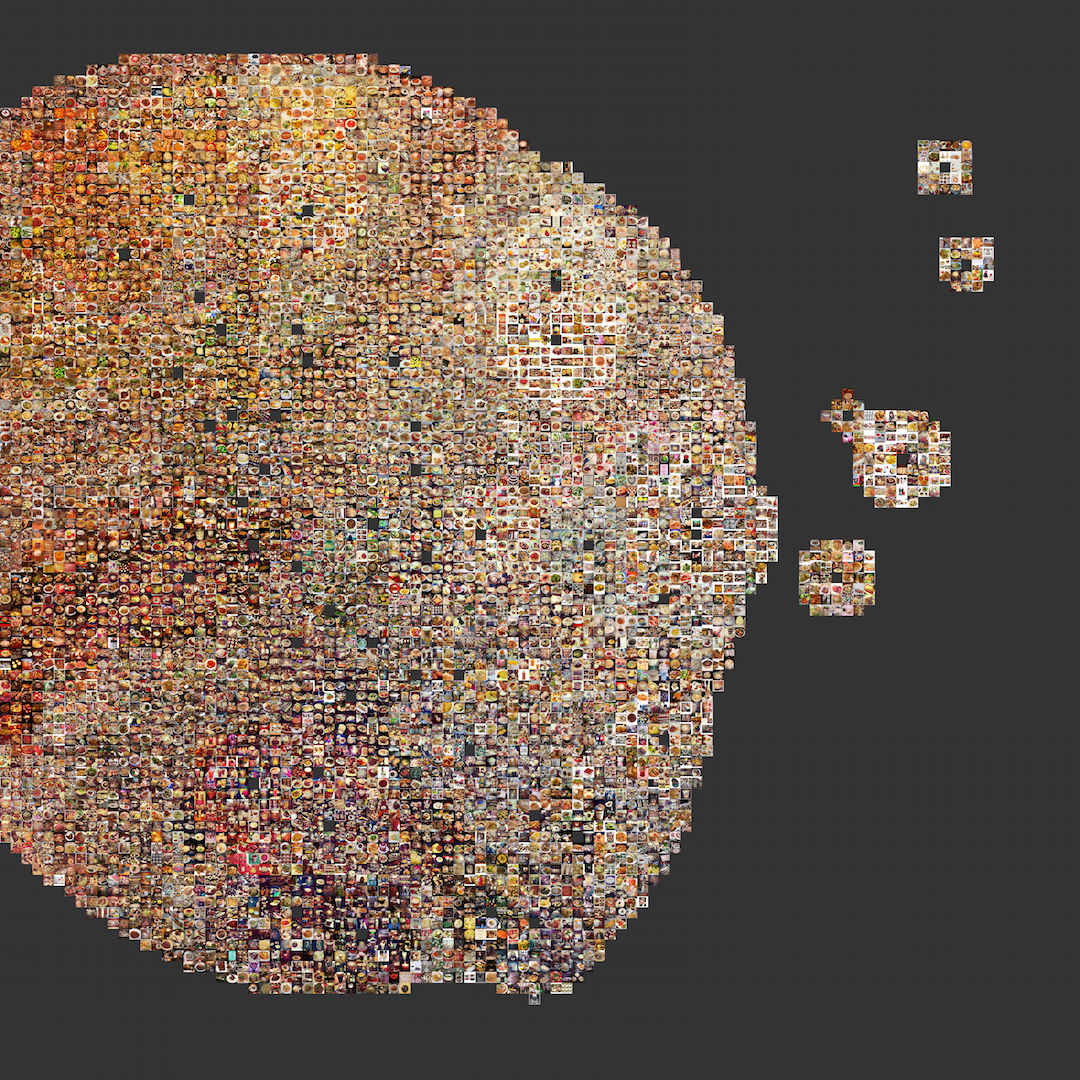
A growing entourage plot of food images posted to Instagram from five global cities. Cluster centroids—the empty squares—are plotted relatively close together, and their respective “entourages” mingle together to form a blob-like shape. The choice of plotting distance between centroids will determine the final look of the plot, as shown below.
Growing Entourage Plot
The growing entourage plot is a method for visualizing high-dimensional clusters of images. Ordinarily, visualizing similarity relations among images involves extracting high-dimensional feature vectors that describe the images and subsequently projecting or embedding these vectors into a two- or three-dimensional subspaces. One problem with this approach is that dimensionality-reduction methods typically lose a significant amount of information. Another problem is that the visual presentation of images in a subspace confronts the problem of occlusion: since images are extended in visual space, images that occupy the same region of the subspace will plot atop each other, making at most one of them fully visible. The growing entourage plot solves both of these problems. Images are clustered in the original high-dimensional space—which minimizes information loss—and then these
clusters are projected into a subspace where at most one image can occupy a given grid location. The final look of the plot can be controlled by choosing the distance between cluster centroids. The result is a two-dimensional representation of a high-dimensional similarity space with minimal information loss. We used growing entourage plots in our
Photo Cultures project, published in
ACM Multimedia 2016.
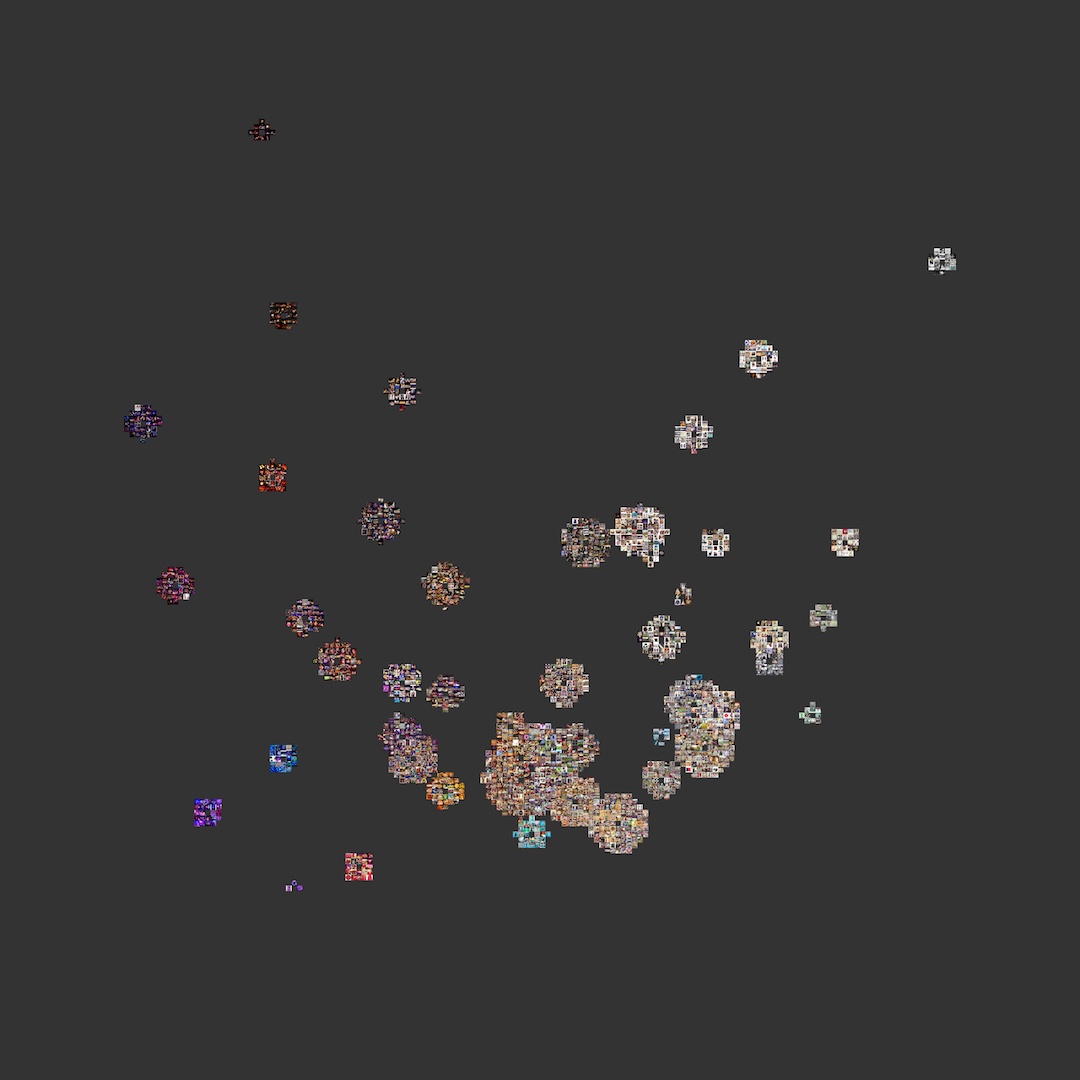
A growing entourage plot of “activity” images. Cluster centroids are plotted relatively far apart, leaving most clusters isolated from their neighbors.
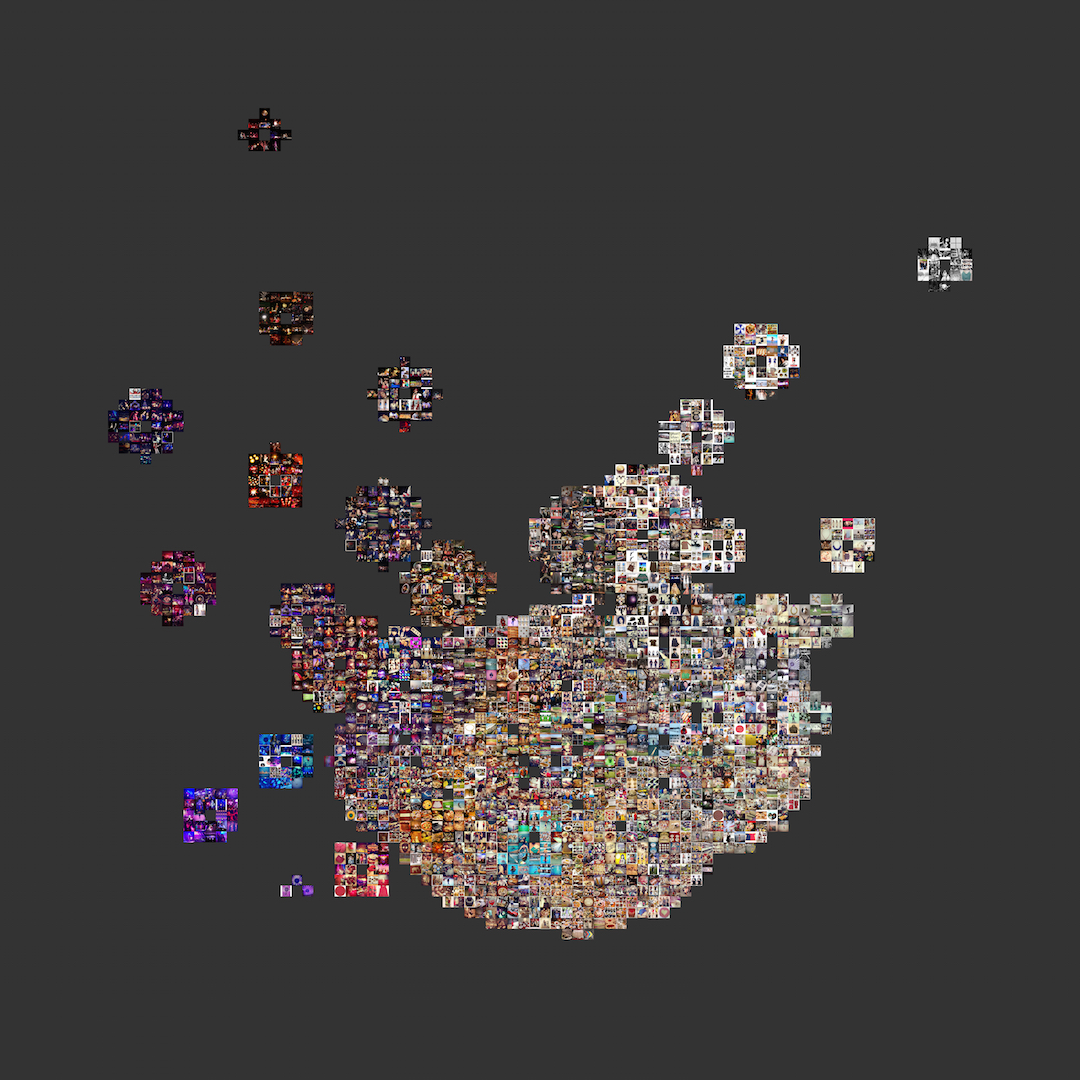
A growing entourage plot with the same data and embedding parameters as above, but with centroids plotted closer together. Neighboring clusters mingle together, changing the overall look—and perhaps analytical function—of the plot.

