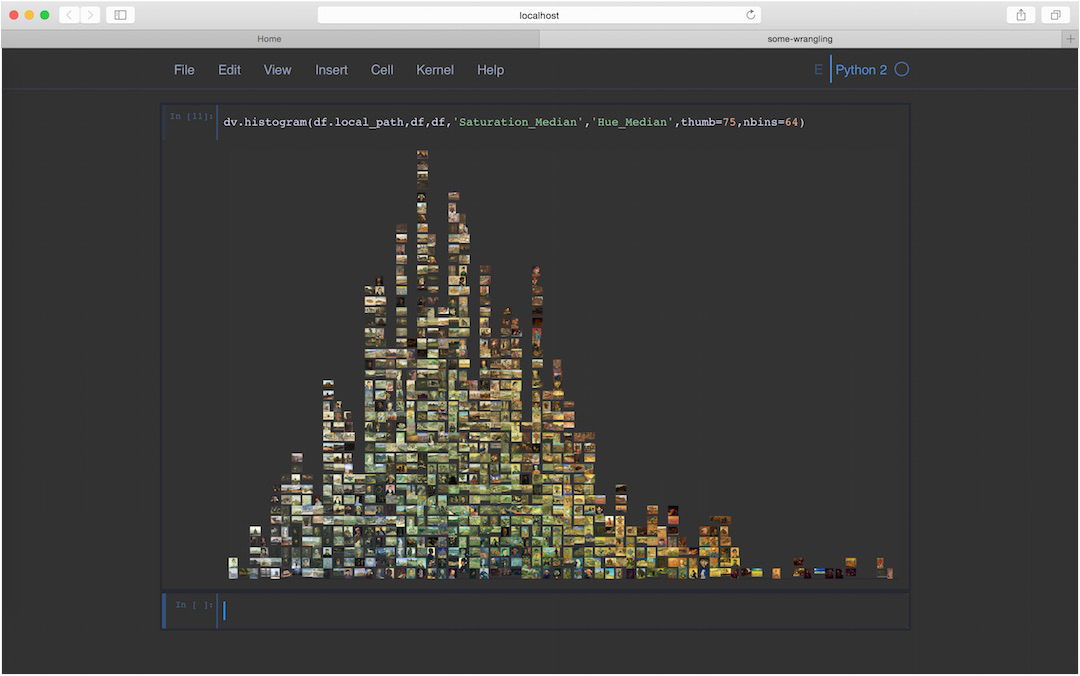
Screenshot of iv.py in use inside a Jupyter notebook environment. Although the library can be used like any Python module—in scripts, at a terminal, in IPython sessions—it is designed for use inside computational notebook environments. Here, a single line of code produces an image histogram of digitized van Gogh paintings. The histogram axis is saturation, and the bins are sorted vertically by hue. Users can easily switch between sorting variables and can choose the number of histogram bins and image thumbnail size. If desired, all plots can be saved inside the notebook. Because Jupyter notebooks are HTML-based, they can be styled with CSS. The iv.py module comes packaged with a special CSS file designed to optimize visual analysis: neutral backgrounds, muted frames, a minimum of visual distractors, etc.
iv.py: Iconographic Visualization ACTIVE
I am in the early stages of designing and building a set of lightweight, open-source visualization tools for the analysis of image data. The tools are meant for researchers whose primary data are images, whose goals are description and explanation (as opposed to, say, prediction or intervention), and whose domains of study are “high-level” in the sense that their observed regularities, whatever they be, cannot be cast as simple, exceptionless, numerical laws. This includes those working in digital art history, visual culture, media studies, and perhaps even in social science (using social media images), architecture and urban studies (using street level imagery), and geospatial science (using satellite imagery).
This research will beget three distinct products. The first is simply the visualization software itself—the code, written as a Python module and published in a GitHub repository. The module will provide a set of functions that sort digital images in various ways and paste them to digital canvases, together (in some cases) with annotations, glyphs, and graphs. Additionally, the module will provide convenience functions for a variety of visual feature extractors found in software libraries like
scikit-image,
OpenCV, and
Keras. The module functions are designed to work both inside of “notebook”-style programming environments and on much larger and even immersive displays, if available.
Second, because the software is aimed at researchers in the digital humanities and not at software engineers, the code will be accompanied by clear, comprehensive documentation, written in detailed, conversational English, along with tutorial notebooks containing basic code recipes and advanced use-cases. The notebooks will serve as interactive learning tools, and will include—unlike most documentation—not only tool-specific information but also theoretical and practical background in direct visualization.
Third, the design of both software and documentation will be guided by a focused user study, involving 3-5 expert researchers working with data either from Yale's extensive digital collections or elsewhere. This will ensure that users' needs are the main drivers of the design process and that their expertise is not wasted. The study will aim to maximize both the learnability and usability of the software as well as its analytical power—in particular, the extent to which the derived visual features provide helpful search indices. Direct visualizations are only as powerful as their sorting features, and I anticipate that the selection and construction of domain-relevant feature spaces and visual categories will figure centrally in the proposed research.

