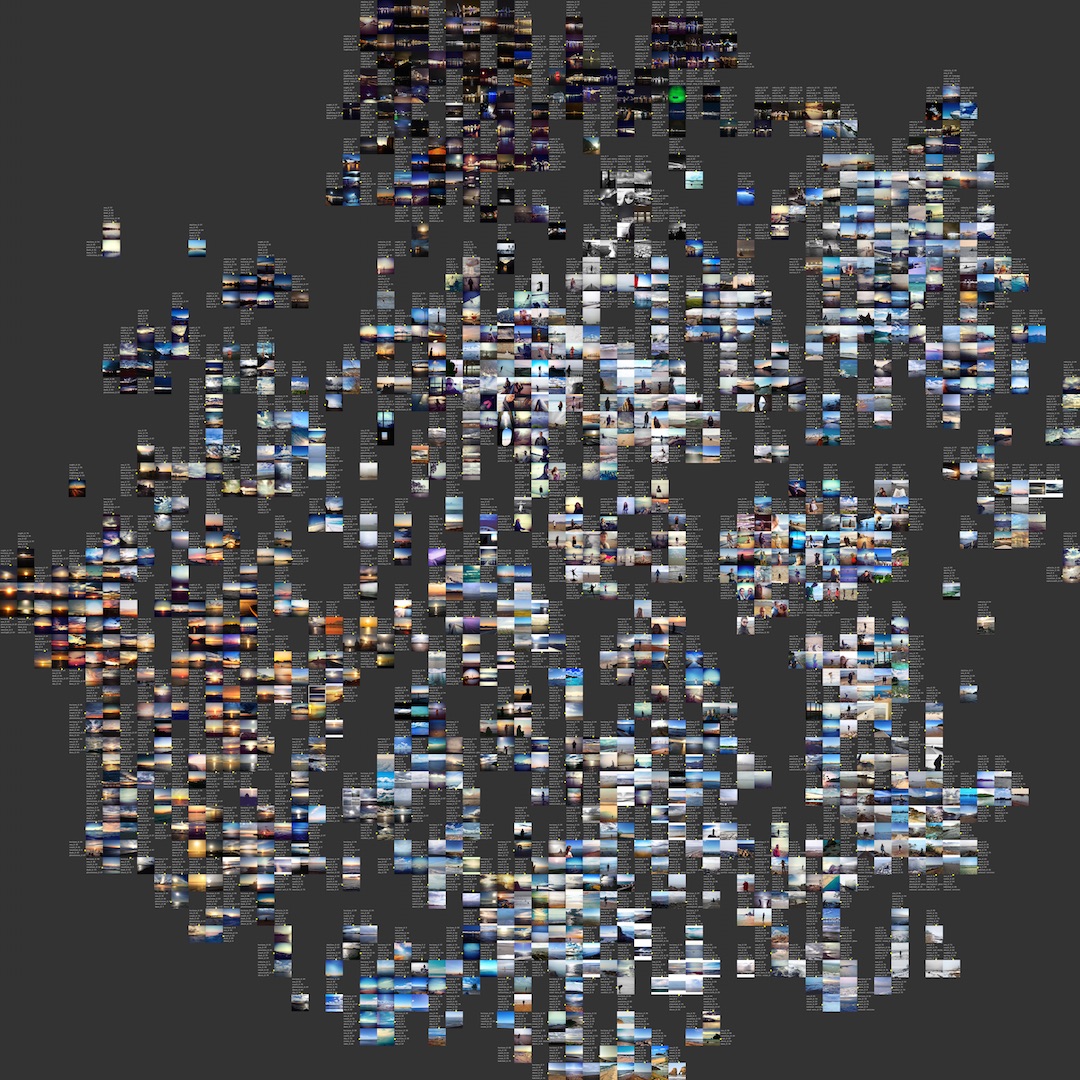
Tag-annotated t-SNE map of images posted to Instagram from St. Petersburg, Russia. The images are arranged in “tag space”—a similarity space defined by confidences scores for machine tags—but all bear the tag “sea”. See zoom detail below.
St. Petersburg Instagram
The availability of large urban social media data creates new opportunities for studying cities. We propose a new direction for this research: a joint analyis of geolocations of shared images and their content as determined by computer vision. To test our ideas, we use a dataset of 47,410 Instagram images shared in the city of St. Petersburg over one year. We show how a combination of semantic clustering, image recognition, and geospatial analysis can detect important patterns related to both how people use a city and how they represent it in social media.
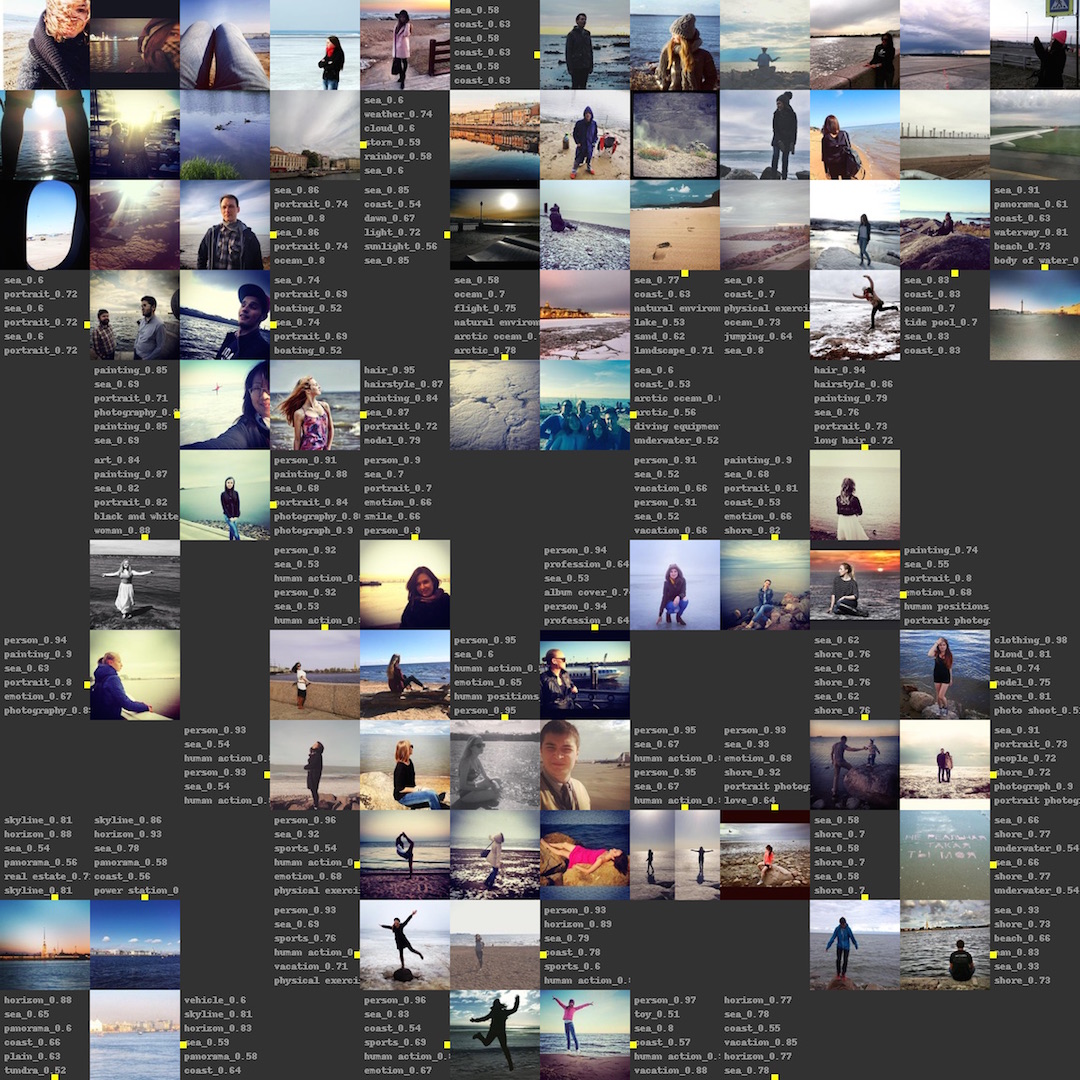
Zoom detail of above image. Tag lists are bound to images using yellow dots. Not all tags are visible in every case; some images have more than ten tags. Although the tag lists pictured here are generally accurate, machine-taggers can make mistakes if two semantically distinct photographic subjects nonetheless look the same, or if two subjects that co-occur in the training data fail to do so in new data.
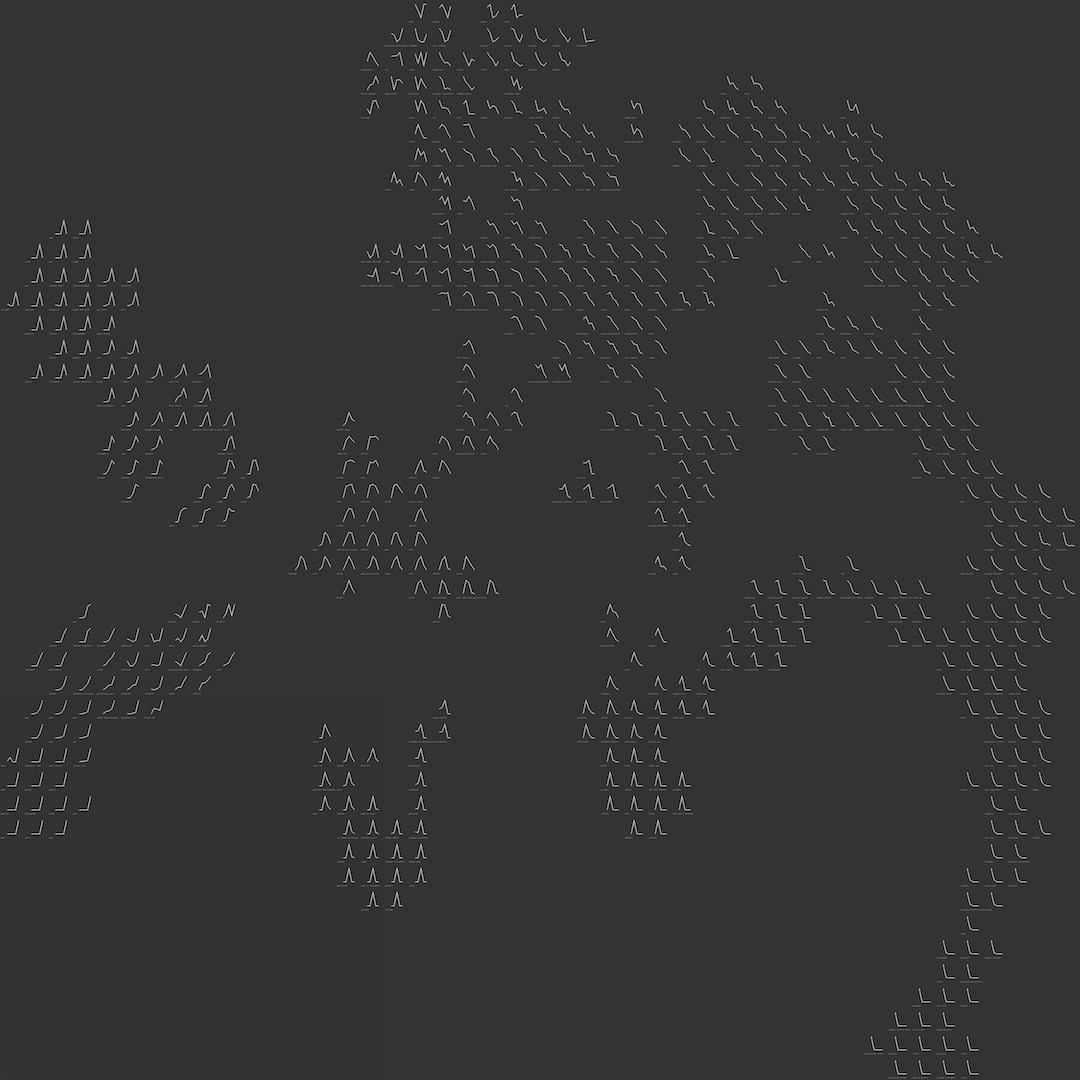
A t-SNE map of tags. Each tag is represented by a “histogram line”, a simple line plot that traces along the tops of the five bins of a histogram of confidence scores for that tag. It is clear from this plot that tags differ a great deal in their score distributions. Some tags, like those in the lower left hand corner, have very few low confidence scores and rise sharply thereafter; others, like those in the lower right corner, have the opposite pattern. Some, like those in the lower middle, have most of their scores in the middle. Tag scores range between 0.5 and 1.0.

