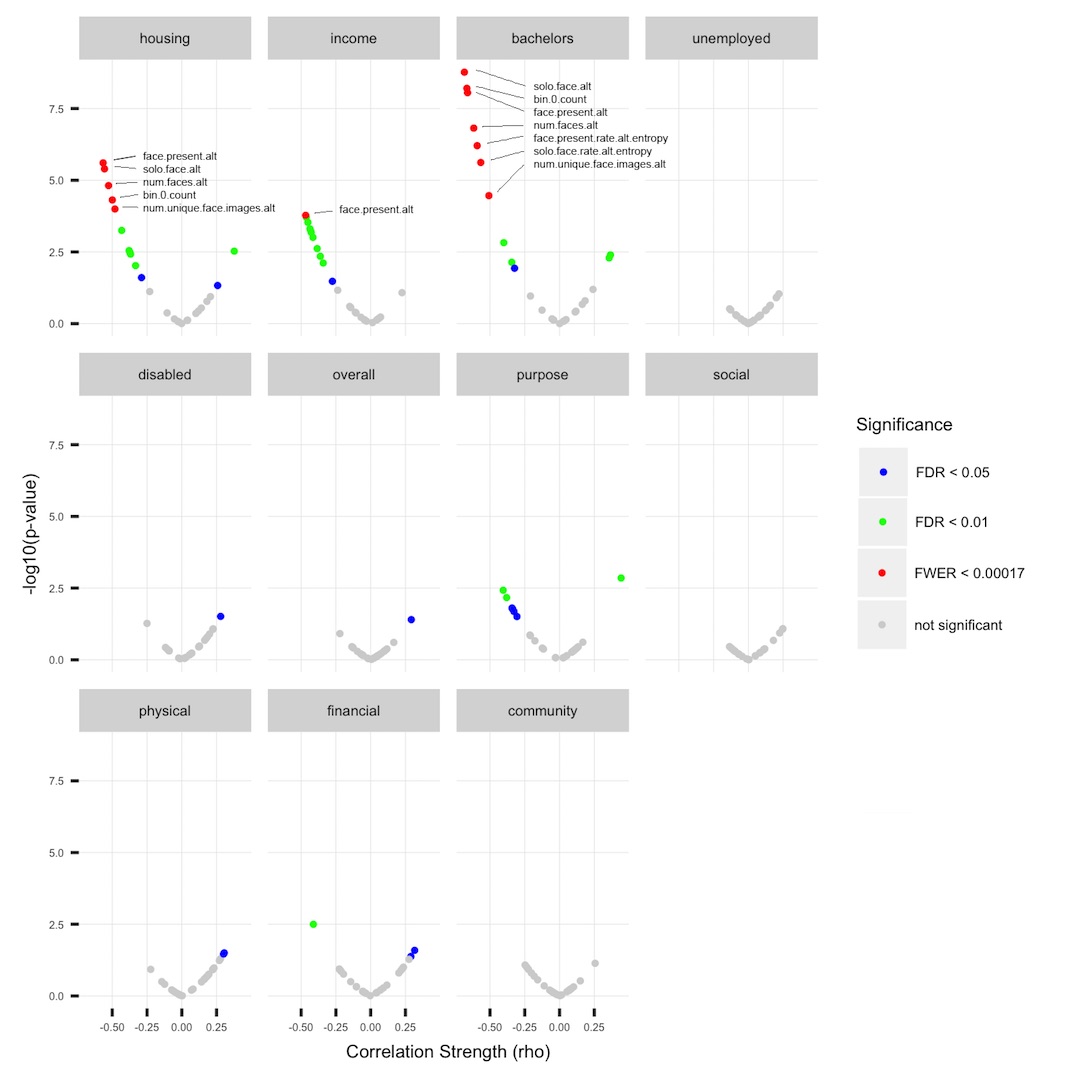
A small multiples (or faceted) plot showing the relationship between correlation strength (ρ) and p-value for pairs of variables in our data. Relationships between numbers of faces in images and housing, income, and education are particularly strong. Red dots represent visual variables whose correlation with the indicated socioeconomic variable has a family-wise error rate of less than 0.00017. Across housing, income, and education, “face present”—meaning the image contains at least one face—is an excellent predictor.
Socioeconomics and Tweeted Images
Traditional methods of recording socio-economic information
about populations, such as censuses and surveys, have
poor temporal resolution and are costly to conduct. More
recently, computational models that use text features from
online social network posts can predict several key socioeconomic
variables at high accuracies and bypass the aforementioned
limitations. However, even these models so far
only use text (such as tweets), ignoring another key type
of social media: images. In this project, we explore features
from visual social media to develop computational models
that estimate several socio-economic characteristics. We extract
simple features, such as color histograms and number of
faces, from over 7 million images posted on Twitter in 2013
across 60 U.S. cities. We find that aggregated characteristics
of these images can be used to accurately predict income,
housing prices, education levels, and financial well-being indicators.
Our results suggest that images shared on online social
networks reflect socio-economic characteristics and that
this data can compliment existing computational models that
use only text.
