A map showing, alternately, the locations of the 100 cities targeted in our analysis and their relative tweeting volumes. Cities in China, India, and Africa, though very large in population, are relatively low in tweeting volume, while cities in Europe, North and South America, and Southeast Asia are relatively high in tweeting volume. The Middle East lies between these extremes.
Visual Earth
Visual Earth is the first study to analyze the growth of image sharing on Twitter around the world in relation to economic, geographic, and demographic differences. We use a unique dataset of 270 million geocoded images shared on Twitter around the world between 09/2011 - 06/2014. We also look in detail at image sharing trends in 100 urban areas situated on five continents.
Rather than considering only the world's largest cities or capitals, we selected these cities using different criteria to better represent the diversity of urban life today. We started with a list of 500 urban areas with at least 1 million people. We then chose 100 cities from this list. Each city needed to have at least 15,000 visual tweets, and no country could have more than one city. The cities in our list vary in size, history, culture, and global importance; they are situated on all five continents in countries with different levels of economic development.
We used a popular economic classification developed by the World Bank that divides all countries into four groups based on gross national income (GNI) per capita. Our list has 20 cities in “low-income” countries, 20 in “lower-middle income” countries, 27 in “upper-middle income” countries and 33 in “high-income” countries. These differences greatly affect image sharing rates and growth over time.
Among the project's findings are the large differences in image sharing growth between these 100 cities. For example, over a 30 month period, the average monthly growth rate was 33.4% in Baghdad and 20.4% in Caracas, but only 9% in London and 9.2% in Barcelona. We analyzed these differences in relation to the level of economic development of the countries where our 100 cities are located, and found a systematic relationship. The lower the level of economic development, the faster the rate of growth of image sharing.
The project website,
visual-earth.net, discusses other findings, including global image sharing growth trends, geographic differences by sub-continent, relationship between image sharing and population age, as well as major trends in the visual characteristics of the images. In addition to presenting the findings, we also propose our predictions for future growth in developing versus developed areas.
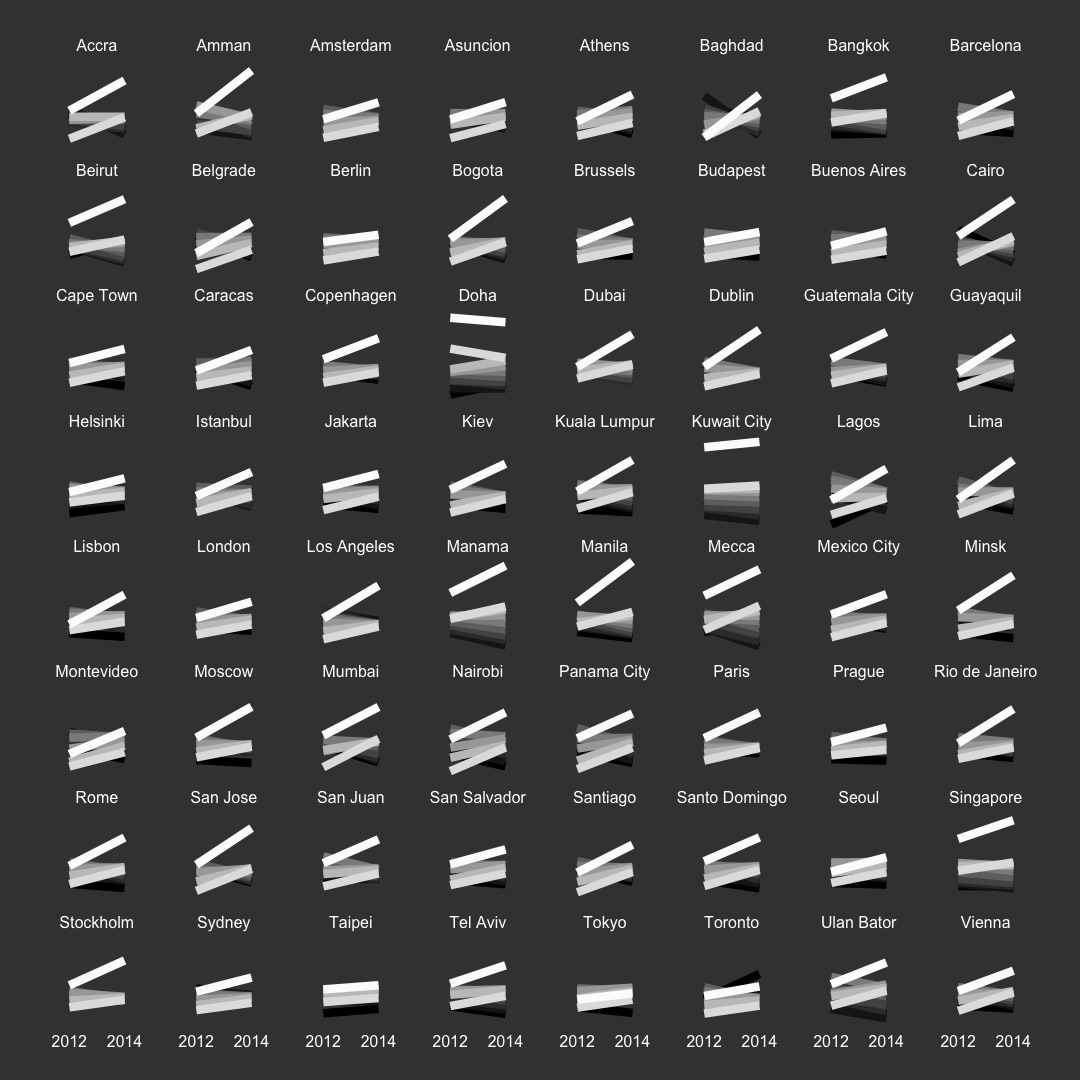
A glyph slopegraph showing the change between 2012 and 2014 in the proportions of each of 10 brightness bins of slices of images posted to Twitter from 64 cities in our data. In nearly all cities, the brightest slices have increased relative to the rest. This may be due in part to an increase in screenshots, which doubled in our data (from 8% to 16% of all images) between 2012 and 2014. On average, screenshots are brighter than non-screenshots (65% vs. 50% mean brightness). Additionally, camera processing software has changed over time: modern digital photo processing boosts the brightest parts of photos to enhance their visual appeal.

